I have a couple questions regarding NTOs and NDOs.
Is there a way to generate natural orbitals for the difference density (NDOs) in Q-chem (preferably in cube files)? I’m interested in obtaining them both for TDDFT calculations and when I have two separate densities (for the same geometry and basis set).
I’d like to obtain natural transition orbitals (NTOs) for three lowest triplet states of my system. Even though I specify “cis_singlets = false” in my input ($rem and $plots sections of myinput pasted below), Q-Chem runs analysis of the singlet states as well. Why is that?
Moreover, it performs NTO analysis for all the excited states (both singlets and triplets) using the state-averaged NTOs. Are the NTOs averaged over all the states (triplets and singlets, even though only triplets were required), or is it done only for the triplets?
(1) It appears that NDOs are available through libwfa; see manual.
(2) Why do you say that the NTOs are state-averaged? I also do not see the problem that you indicate when I run a job with your input. Note that by specifying CUBEFILE_STATE = 1, you are asking to get a set of NTOs for one particular state. That’s what I see in my output.
I did try to generate them, but unfortunately with no success. The variations of input that I tested are: (everything in rem section stayed the same as in the original question, I just paste the parts that were changing)
In i) and ii) I get the same set of orbitals as before, which I believe are NTOs (is that correct?).
In iii) I get an empty directory called filename.plots.
So what should I have in my input to actually obtain the NDOs?
Yes, you are right, thank you.
I was looking at the third job in the same run, where I ran the wavefunction analysis. There I was analyzing the excited states, both triplet and singlet, and there I had a section called “State-Averaged NTO Decomposition”, thus the second part my original question, which I did misformulate, I’m sorry.
The manual suggests that LIBWFA (activated by setting STATE_ANALYSIS = TRUE) supports NDOs, though the details are unclear. What are you trying to plot? Natural orbitals of relaxed DeltaP ?
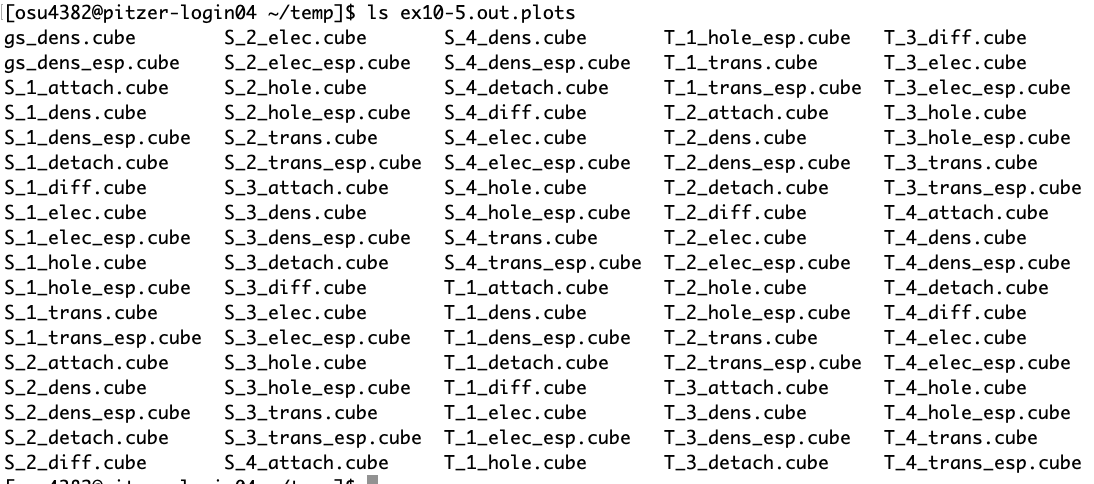
What’s more, I tried running input straight from the manual (https://manual.q-chem.com/latest/subsec_esanacc.html, example 10.5), and while I do obtain orbitals’ analysis (via libwfa), I am still not getting any orbitals. I’m using Q-Chem version 6.0.1. What could possibly be the issue?
The same directory appears is $QCSCRATCH/ex10-5/plots so check there if you don’t find this. (That should get copied at the end to the directory from which you ran the calculation.)
Yes, I was getting the directory filled with cube files of various densities, but as I had said before - I was interested in obtaining orbitals, so files with _ndo.mo, _nto.mo and _no.mo endings.
Ultimately I was able to generate them. In order to do that, in 10.5 example I needed to set make_cube_files = false (the support team said that Q-Chem doesn’t yet allow for simultaneous generation of both cube and molden-formatted files, so it’s one or the other). When I did that I got what I was looking to generate:
Moreover, to obtain orbital files from my original input, I also had to set iqmol_fchk = false as well and use old $plots input (which needed plots = false) (I wasn’t able to get the orbitals using the new $plots input at all).
Just a comment here. You don’t actually want the ESP_GRID = -3 option. This will cause Q-Chem to compute the ESPs associated to all transition, excess electron, and hole densities. This is quite expensive.
Otherwise, there is the keyworkd WFA_LEVEL =4 that will produce cube files of the NTOs if MAKE_CUBE_FILES is on. I don’t know if it will produce NDOs. I’ll have another think about how to do the keywords and documenting them.
And, by the way, if you add CIS_RELAXED_DENSITIES to the above input, then you will get the NDOs and attachment/detachment densities also for the relaxed densities.