(b) I can’t solve this issue without the input file (including molecular coordinates), and it would be helpful if you could provide a minimal basis (small basis and small molecule).
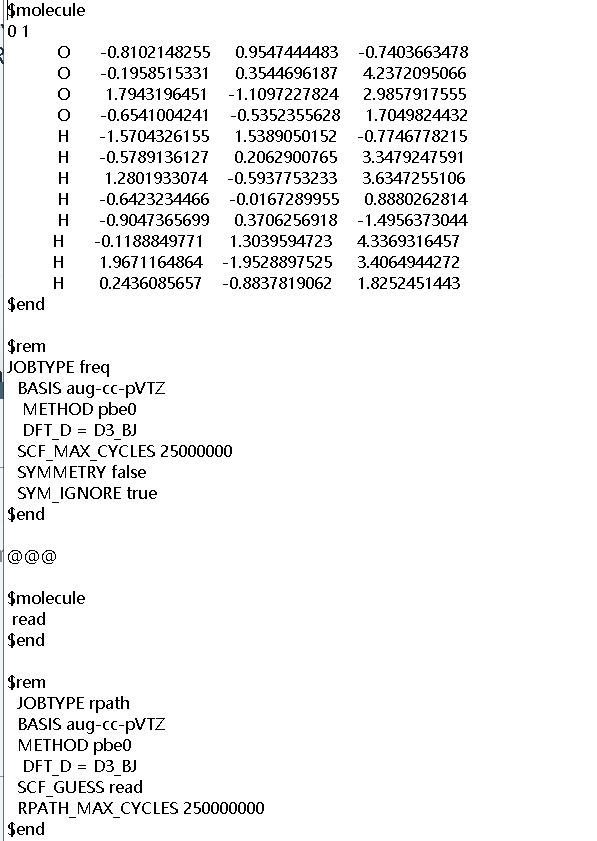
Thank you very much for your patience and help, the input file was displayed , as follows:
$molecule
0 1
O 0.0038887696 -0.0102488494 0.0473750939
O -0.0038442878 -0.0111764720 3.8628084944
O 1.9071776921 0.0104817575 1.9590674296
O -1.9073001025 -0.0261823425 1.9510540344
H 0.7830889866 -0.0085279483 0.6486520261
H -0.7829356612 -0.0247796167 3.2615475436
H 1.3061082289 0.0091742108 2.7384555637
H -1.3064846453 -0.0145489194 1.1715878823
H 0.1044665570 0.7566117128 -0.5178398149
H -0.1176673445 0.7558790502 4.4252617882
H 2.4793923263 -0.7504277425 2.0650991913
H -2.4648314094 -0.7977040104 1.8434595876
O -0.9511249722 -0.3795538207 -0.1216620894
O 0.4055041397 0.1164225647 4.8049620219
O -2.2252030040 -0.7540516343 4.7605558746
O -1.0683941537 0.5935126158 2.5700078854
H -0.0741199871 -0.3587986445 -0.5098634599
H 0.1314416081 0.3535548544 3.8953872408
H -1.3112823208 -0.5521796168 5.0350727701
H -1.0430516170 0.1930629667 1.6896256299
H -1.4894473902 0.1875626621 -0.6778103909
H 1.1318206388 -0.5008015494 4.7112093835
H -2.7884257761 -0.2798604108 5.3735785750
H -1.7359479620 0.1090099721 3.0811834466
$end
$rem
JOBTYPE rpath
BASIS aug-cc-pVTZ
METHOD pbe0
DFT_D = D3_BJ
SCF_GUESS read
RPATH_COORDS=0
RPATH_MAX_CYCLES 50
RPATH_MAX_STEPSIZE=10
RPATH_TOL_DISPLACEMENT=100000
$end
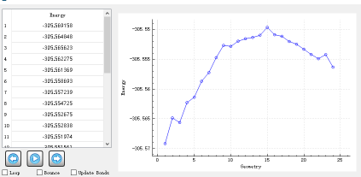
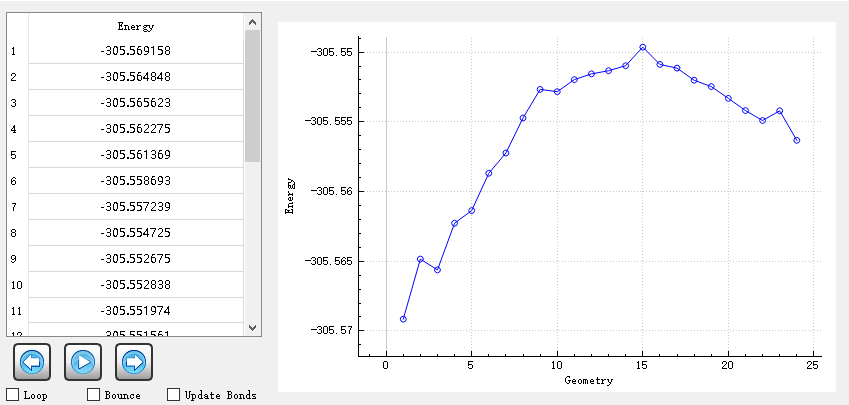
Based on this, we calculated the transition state and its intrinsic reaction coordinate. The IQmol figure is as follow:
In short, there are some questions that require your help.
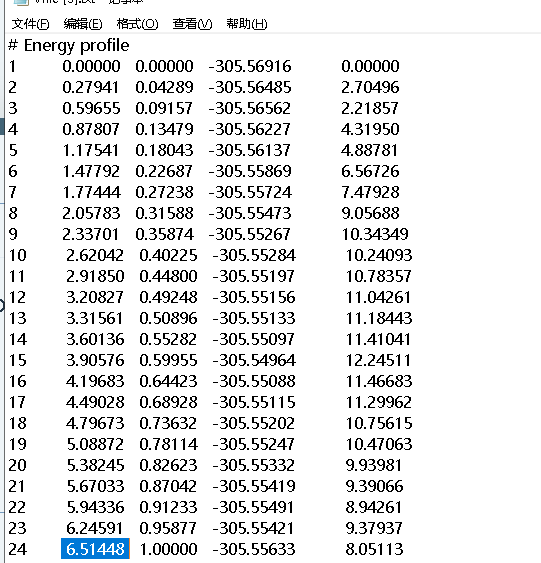
1.We want to obtain the mass-wighted IRC figure, and we want to know where to get the mass-wighted IRC coordinates? in .out or Vfile.txt or others? In the second column of Vfile.txt, does the value from 0 to 6.51448 refer to the mass-weighted coordinate?
2.The current IRC figure displayed in IQMOL seems to be via the FSM method, not the standard IRC, how do I get the IRC figure from the IRC and rpath commands?
I don’t think that you want to run this as a sequence of compound jobs. Run them one at a time and pay attention to the output at each step. Run the FSM job, go to stringfile.txt and find the highest-energy structure, use that as your guess for the subsequent TS search. Confirm the TS with a frequency calculation. Then do the IRC search.
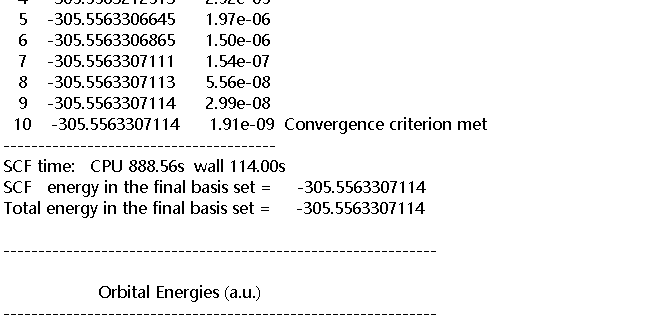
Based on the SCF energy that you are showing me, and comparing to the list of energies from Vfile.txt, this structure is almost certainly not the TS. Did you check it with a frequency calculation?
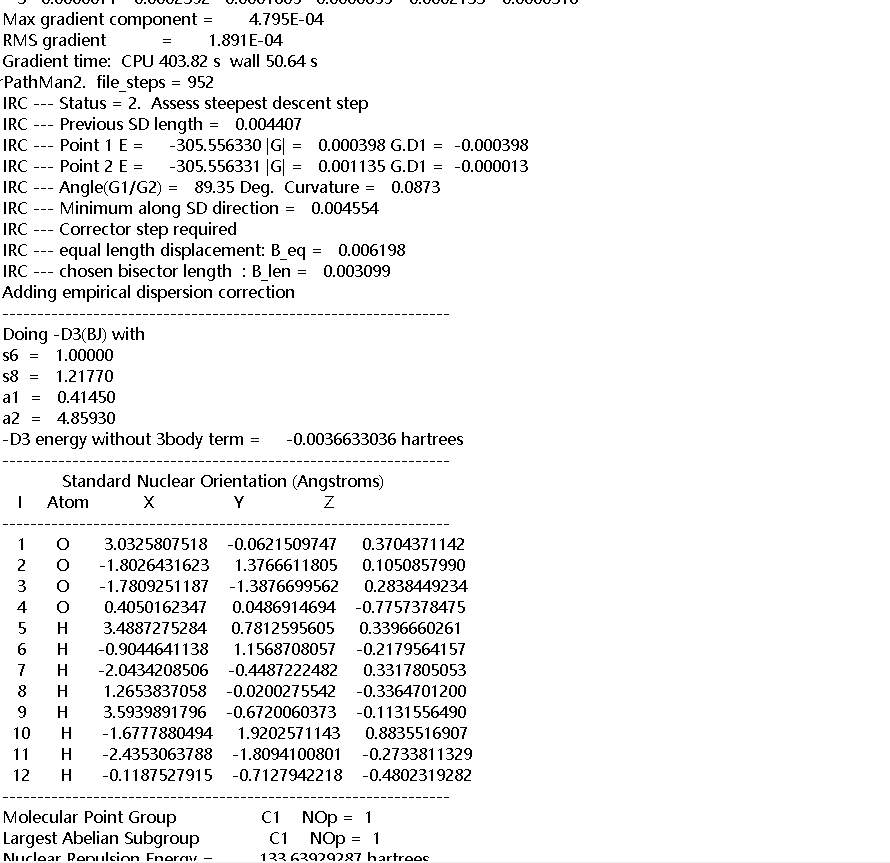
In recent versions of Q-Chem, a successful IRC calculation will print the sequence of geometries that comprise the path at the end, with a heading
Great. I just checked an the cleanup of the IRC output was indeed released only with 6.0.2. (That capability with IQmol is still pending but once you have the structures from the Q-Chem output, they can be visualized in a variety of ways.)