Is there a way to visualize the frequencies obtained from doing a partial hessians calculation?
what does the output look like?
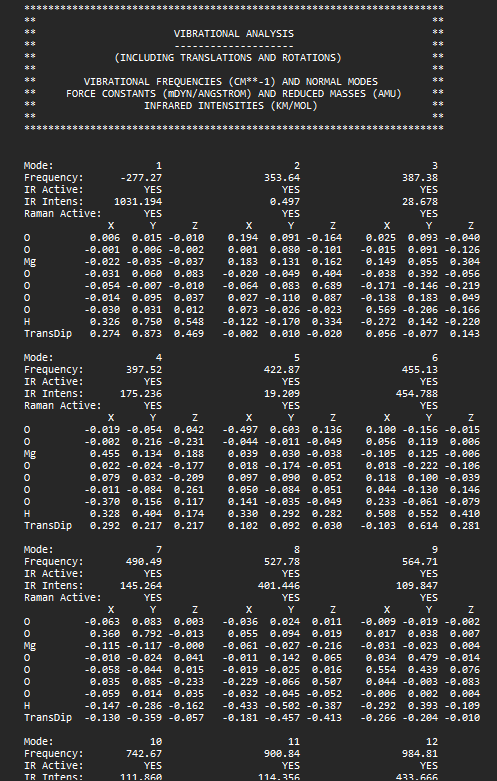
Looks like normal Q-Chem vibrational frequency output format. Why not try MOLDEN_FORMAT = TRUE and use the MolDen program to visualize?
I will try that and let you know if that works - takes about 1-2 days for my calculations to run due to the size of the system.
My second question is I am trying to do a TS calculation after the partial hessians frequency job, however the TS job is having trouble reading the partial hessians. Is there a way around this?
No idea if that functionality is even implemented. Possibly not, so perhaps you can send a bug report to Q-Chem support. Would be best to try a small sample job, not something that takes a day to crash.